def add_box(ax, x, y, w, h, text, edgecolor, facecolor,
            fontsize=8.0, textcolor='#222222'):
    patch = FancyBboxPatch(
        (x, y), w, h,
        boxstyle='round,pad=0.05,rounding_size=0.08',
        facecolor=facecolor,
        edgecolor=edgecolor,
        linewidth=1.5
    )
    ax.add_patch(patch)

    ax.text(
        x + w / 2,
        y + h / 2,
        text,
        ha='center',
        va='center',
        fontsize=fontsize,
        color=textcolor,
        linespacing=1.22
    )


fig, ax = plt.subplots(figsize=(7.5, 3.5))
ax.set_xlim(0, 10.25)
ax.set_ylim(0, 4.30)
ax.axis('off')

row_colors = [COLOR_PRIMARY, COLOR_ORANGE, COLOR_GREEN]
row_labels = ['正态线性模型', 'Logit 模型', 'Poisson 模型']

left_texts = [
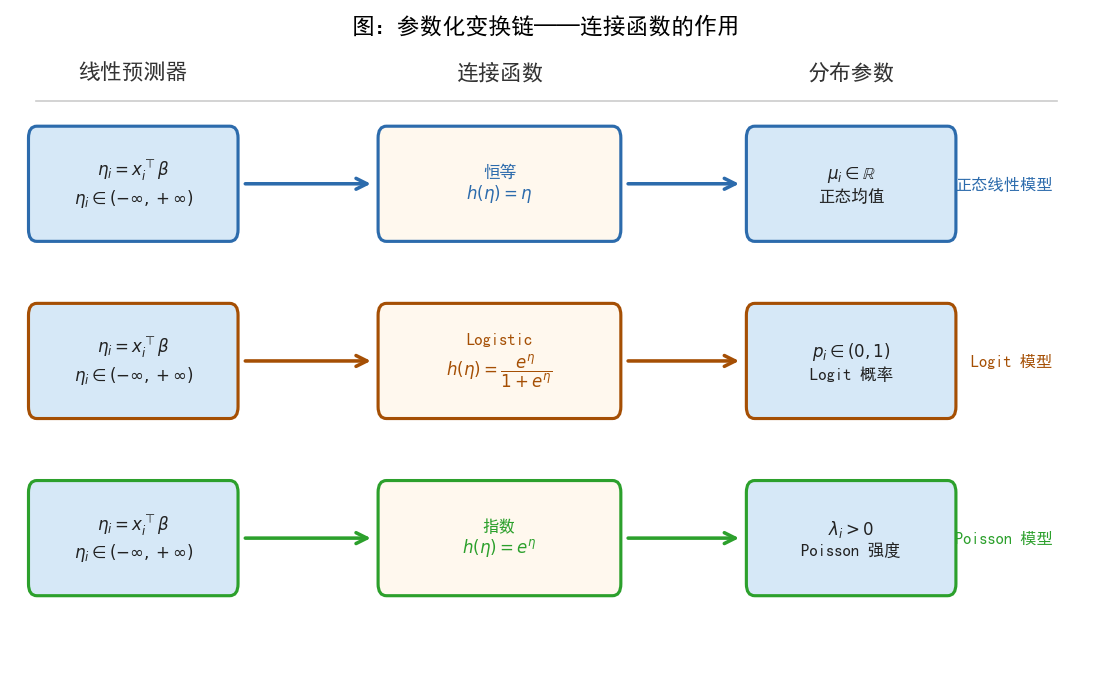
    '$\\eta_i = x_i^\\top \\beta$\n$\\eta_i \\in (-\\infty, +\\infty)$',
    '$\\eta_i = x_i^\\top \\beta$\n$\\eta_i \\in (-\\infty, +\\infty)$',
    '$\\eta_i = x_i^\\top \\beta$\n$\\eta_i \\in (-\\infty, +\\infty)$'
]

mid_texts = [
    '恒等\n$h(\\eta) = \\eta$',
    'Logistic\n$h(\\eta) = \\dfrac{e^{\\eta}}{1 + e^{\\eta}}$',
    '指数\n$h(\\eta) = e^{\\eta}$'
]

right_texts = [
    '$\\mu_i \\in \\mathbb{R}$\n正态均值',
    '$p_i \\in (0,1)$\nLogit 概率',
    '$\\lambda_i > 0$\nPoisson 强度'
]

y_positions = [3.30, 2.10, 0.90]

box_w_lr  = 1.92
box_w_mid = 2.24
box_h     = 0.68

left_x  = 0.18
mid_x   = 3.55
right_x = 7.10

arrow_gap = 0.12
label_x   = 10.00

header_y = 4.06
line_y   = 3.86

header_x = [
    left_x + box_w_lr / 2,
    mid_x + box_w_mid / 2,
    right_x + box_w_lr / 2
]

header_titles = ['线性预测器', '连接函数', '分布参数']

for x, title in zip(header_x, header_titles):
    ax.text(
        x, header_y, title,
        ha='center',
        va='center',
        fontsize=10.5,
        fontweight='bold',
        color='#333333'
    )

ax.axhline(
    line_y,
    color='#CCCCCC',
    lw=0.8,
    xmin=0.02,
    xmax=0.98
)

for i, y in enumerate(y_positions):

    color = row_colors[i]

    add_box(
        ax=ax,
        x=left_x,
        y=y - box_h / 2,
        w=box_w_lr,
        h=box_h,
        text=left_texts[i],
        edgecolor=color,
        facecolor=COLOR_FILL,
        fontsize=8.0,
        textcolor='#222222'
    )

    ax.annotate(
        '',
        xy=(mid_x - arrow_gap, y),
        xytext=(left_x + box_w_lr + arrow_gap, y),
        arrowprops=dict(
            arrowstyle='->',
            color=color,
            lw=1.7,
            mutation_scale=13,
            shrinkA=0,
            shrinkB=0
        )
    )

    add_box(
        ax=ax,
        x=mid_x,
        y=y - box_h / 2,
        w=box_w_mid,
        h=box_h,
        text=mid_texts[i],
        edgecolor=color,
        facecolor='#FFF8EE',
        fontsize=8.0,
        textcolor=color
    )

    ax.annotate(
        '',
        xy=(right_x - arrow_gap, y),
        xytext=(mid_x + box_w_mid + arrow_gap, y),
        arrowprops=dict(
            arrowstyle='->',
            color=color,
            lw=1.7,
            mutation_scale=13,
            shrinkA=0,
            shrinkB=0
        )
    )

    add_box(
        ax=ax,
        x=right_x,
        y=y - box_h / 2,
        w=box_w_lr,
        h=box_h,
        text=right_texts[i],
        edgecolor=color,
        facecolor=COLOR_FILL,
        fontsize=8.0,
        textcolor='#222222'
    )

    ax.text(
        label_x, y, row_labels[i],
        ha='right',
        va='center',
        fontsize=7.8,
        color=color,
        style='italic'
    )

ax.set_title(
    '图:参数化变换链——连接函数的作用',
    fontsize=11,
    y=0.985
)

plt.tight_layout(pad=0.40)

plt.savefig(
    './figs/method_MLE_fig05_parameterization.png',
    dpi=300,
    bbox_inches='tight',
    pad_inches=0.03,
    facecolor='white'
)

plt.savefig(
    './figs/method_MLE_fig05_parameterization.svg',
    bbox_inches='tight',
    pad_inches=0.03,
    facecolor='white'
)

plt.show()
print('fig05 已保存')